the fed pivot The market is pricing a change in policy, but is the market right?
Report by: Ben Jones Published: 18th August 2022
Key points:
- Both the bond and equity markets are pricing for a Fed pivot – we see this through the equity rally, the drop in yields in longer term treasuries and eurodollar futures pricing.
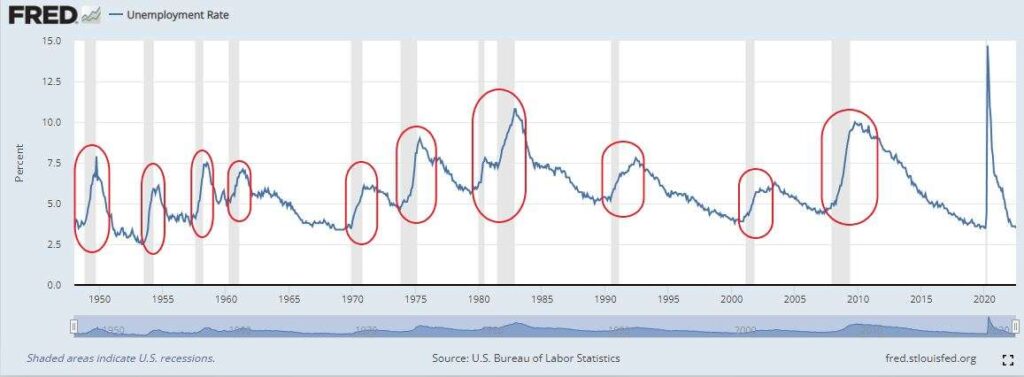
- A high unemployment rate is the key data point that will put pressure on the Fed to pivot. Unemployment lags – it typically starts recessions at low levels and peaks at the back end of recessions.
- The yield curve, consumer sentiment, and real income data are all flashing for a recession and showing signs of peak hiking cycle.
- The Fed will continue hawkish rhetoric to maintain credibility but will be forced to pivot by worsening recession data.
Over the last 2 months, both the bond and equity markets have shifted to reflect the Fed being nearly done with hiking. The S&P 500 has rallied 17% from its June lows as the 10 year yield has dropped from 3.5% to 2.9%. However, others are suggesting that the Fed will continue hiking until inflation is back down towards its 2% target. Who is right?
Below we will look at a number of factors that assess Fed policy against recession and inflation. The data would suggest that the market is correct in its view that the Fed is close to peak tightening and that we are likely to see a Fed pivot early next year.
The most important point to note is that we’re already in recession, confirmed recently by the second consecutive negative QoQ real GDP figure. It’s not just the GDP figures screaming recession either.
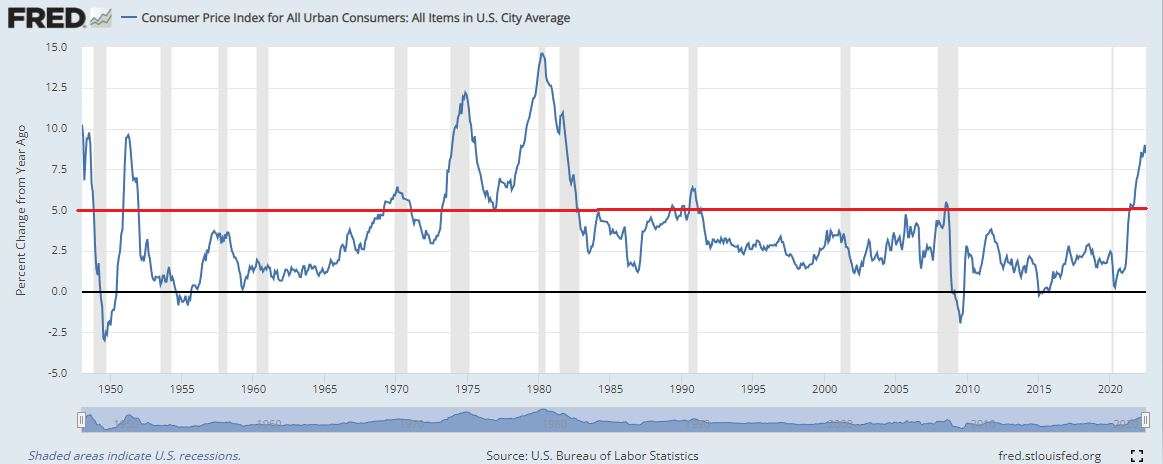
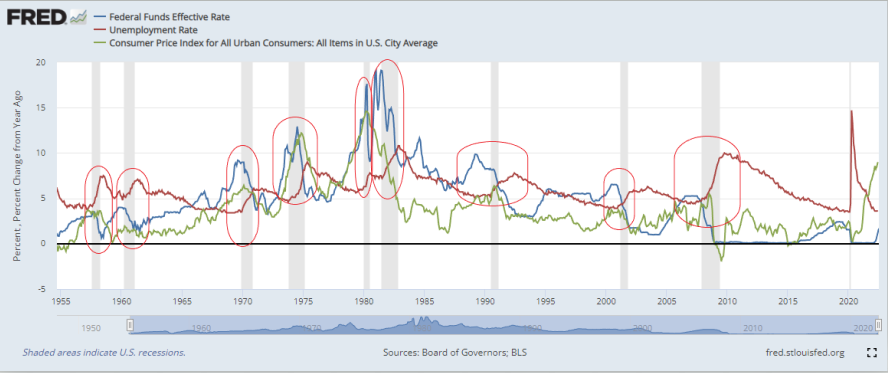
If we look at all previous episodes of high inflation, we can see that they were all accompanied by a recession, including the times where rates remained relatively low. Tightening policy to the point of causing recession has a 100% hit rate in crushing inflation. The Fed may not have finished tightening just yet, but the fact we’re already seeing a recession in the GDP figures suggests we’re getting near to peak inflation and peak tightening.
We can see below that all instances where CPI YoY has exceeded 5% has been accompanied by a recession.
Source: FRED
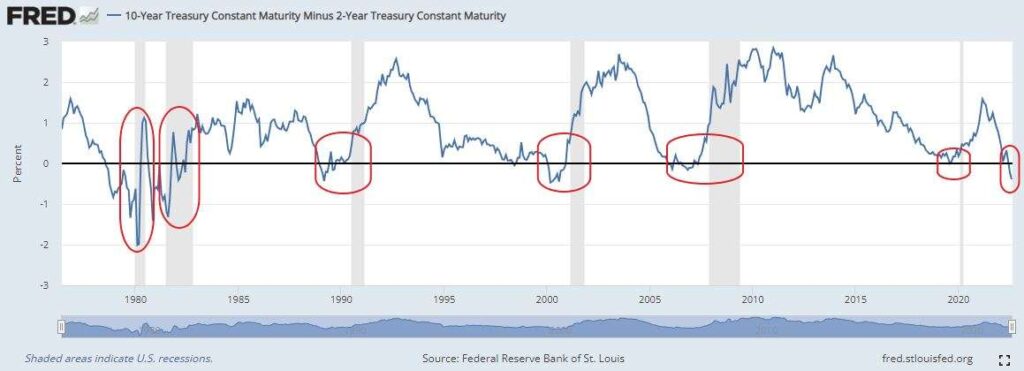
The yield curve is flashing recession. The 2s10s curve is the most inverted since 2000 and very nearly the most inverted since 1981. Inflation and Fed rhetoric are keeping the short end of the curve elevated but investors are already pouncing on the long end in anticipation of weak growth that will come through. Again, curve inversions tend to happen before or at the beginning of a recession as the market anticipates it. The yield curve then steepens through Fed easing and this is for 2 reasons. Firstly, cutting rates drops short term yields significantly as the short end of the curve is more closely controlled by Fed policy. Secondly, Fed easing boosts longer term growth and inflation prospects which helps support longer bond yields. This means peak inversion happens around the time of peak Fed Funds (FF) rate.
Source: FRED
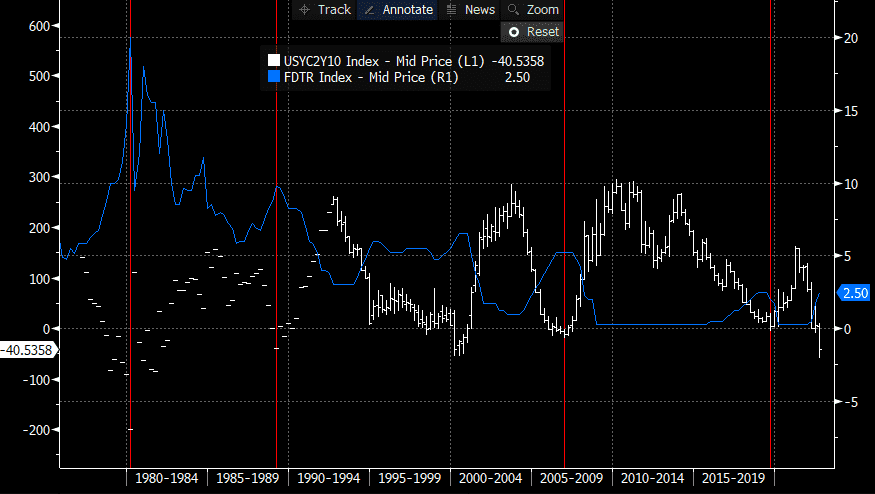
The chart below shows the 2s10s curve (white) and the Fed Funds rate (blue)
APeak inversion comes at the same time as peak Fed Funds (FF) rate
Source: Bloomberg
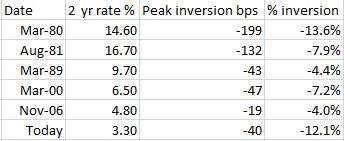
Looking below we can compare peak inversion between the 2 yr and 10 yr to the absolute level of the 2 yr rate. It’s necessary to compare to absolute levels because a 200bp inversion is far more likely when the 2 yr is 14% and the 10 yr 12%, than it is to happen when the 2yr is 2% and the 10yr is 0% for example. We see that the inversion today is nearly as extreme as the largest inversion on record in 1980 relative to absolute rate levels. Again, this would suggest we’re close to peak inversion and peak FF rate.
The % inversion is simply the inversion as a percentage of the 2 yr rate.
Source: Ben Jones Investments
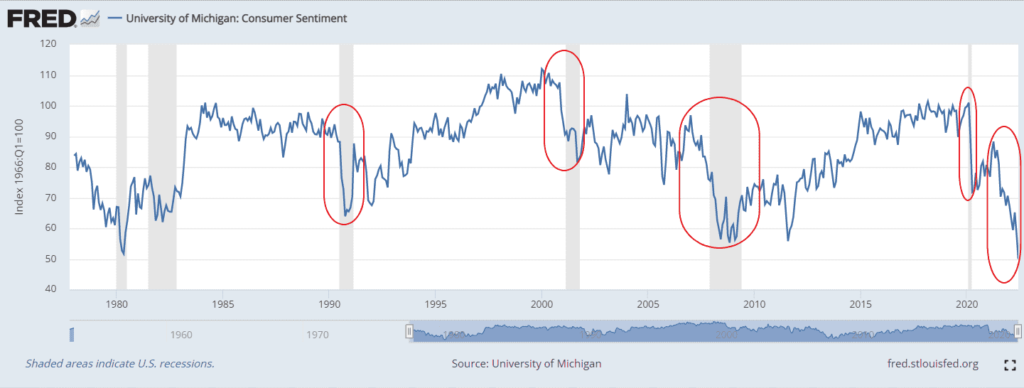
Consumer confidence started dropping in July 2021 and that drop has continued throughout the year. The scale of the drop is highly consistent with former recessionary periods and the latest reading of 50 is the worst reading since data began in 1978.
Source: FRED
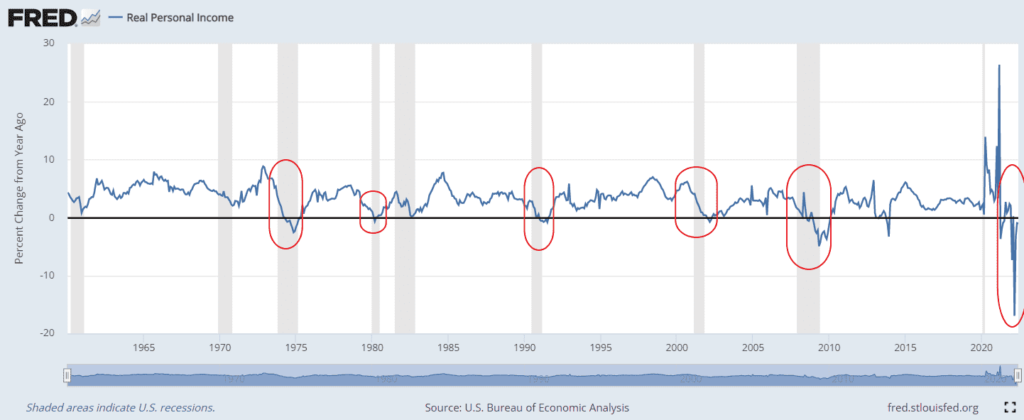
Will a growth slowdown alone force the Fed to pivot?
While a slowdown in growth and economic activity will have the Fed concerned, nothing piles pressure on a Fed Chairman like a high unemployment rate. It was unemployment in the 70s that forced former Fed Chair Arthur Burns into pausing rate hikes or cutting rates despite high inflation.
In an address to the Board of Governors in September 1975, Burns said ‘Our country is now engaged in a fateful debate. There are many who declare that unemployment is a far more serious problem than inflation, and that monetary and fiscal policies must become more stimulative during the year even if inflation quickens in the process. I embrace the goal of full employment, and I shall suggest ways to achieve it. But I totally reject the argument of those who keep urging faster creation of money and still larger governmental deficits. Such policies would only bring us additional trouble; they cannot take us to the desired goal.’
One month after this speech, the Fed unanimously agreed to cut rates from 6.5% to 5.25% expressing ‘doubt concerning the strength of the recovery in economic activity over the quarters immediately ahead’. Unemployment was 9% at the time and placed considerable pressure on both the Fed and the White House.
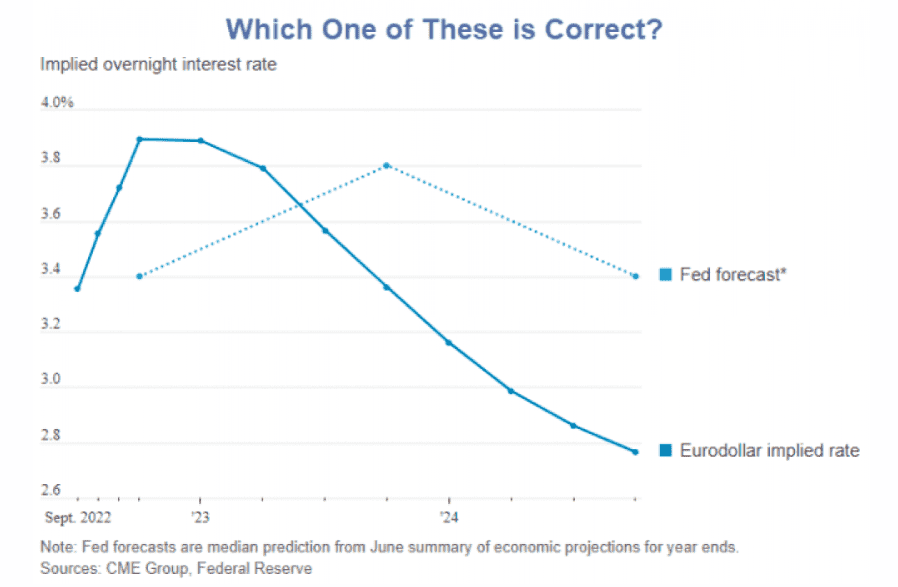
The markets doubted Burns back in the 70s and are already displaying similar doubt towards the Fed’s forecasts today. Eurodollar futures are pricing in cuts for 2023, conflicting with the Fed’s own forecasts that rates will go up in 2023.
I noted that it’s unemployment that typically forces the Fed to back down from tightening policy too aggressively. The reason is that high unemployment becomes intolerable for many Americans and piles immense political pressure directly on to the Fed and the White House. There’s a tipping point where enough jobs with reduced real income is preferable to no job at all for a large portion of the population.
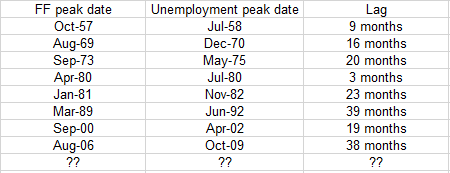
However, there is typically a delay between a recession starting and peak unemployment. Looking below, you can see that unemployment has been at its cycle lows at the beginning of every recession. It has then drifted upwards as the recession has progressed. We are at the very beginning of a recession, as confirmed by the second consecutive negative GDP print for Q2. There is a lag between monetary policy and its effect, and it’s unlikely we’ve hit peak tightening yet.
Unemployment starts recessions around cycle lows
Source: FRED
Source: Ben Jones Investments
Source: FRED
I think the bond market is broadly correct in anticipating a pivot – I expect Fed hikes to continue through the end of this year before a pause is initiated. Given I’m arguing that the Fed will be caught between a rock (high inflation) and a hard place (rising unemployment), I don’t expect an immediate capitulation. The Fed will be too concerned that being too eager to cut will harm their credibility. Instead I think it’s more likely that they pause, even though it becomes increasingly obvious that cuts are required. Only when the Fed see a data point that allows them to cave (it will be an acceptably low inflation figure or an unacceptably high unemployment figure) will they begin to cut. Timing these things is never easy so I won’t try too hard but given the data above, the first half of next year would seem the most likely time frame.
What does all of this mean for asset prices?
- Equities may struggle in the shorter term as the Fed maintains its hawkish rhetoric. They’re particularly at risk when the recession data gets worse and the Fed try to maintain hawkish rhetoric for the purpose of maintaining credibility. Equities then need to deal with the issues of being historically overvalued and suffering from an earnings recession.
- Treasuries may struggle in the short term but I’d expect them to perform next year as worsening recession data starts to impact Fed policy and force the pivot.
- Gold may struggle in the shorter term and perform when the Fed pivot comes next year.
