gold report chapter 1 gold supply and demand
Report by: Ben Jones Published: 29th September 2021
Key points:
- Covid caused a large drop in jewellery demand last year that is slowly recovering and will begin to put a floor under the gold price
- Central Bank buying was hampered by covid last year but has recovered well in 2021 as Central Banks prepare against worldwide currency devaluations
- Investment demand was strong in 2020, and whilst weaker so far in 2021, we expect it to hold firm in future
Supply
The key to understanding the supply and demand dynamics in gold is to know that it’s investment demand that tips the scales. Supply is typically stable at around 4,500 tonnes each year – around 3,500 tonnes comes from new mine supply and a little over 1,000 tonnes comes from recycling. Last year’s lockdowns at mines were very short lived and as a result mine supply was largely unchanged, dropping only 3% from 2019’s output.
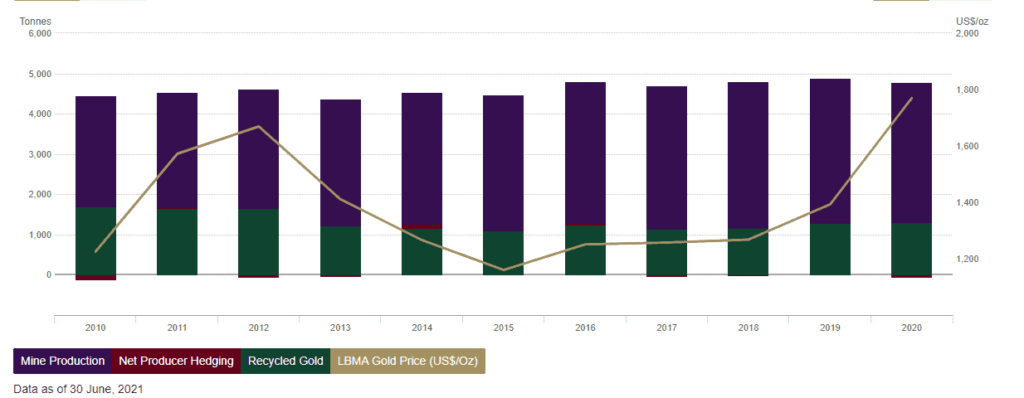
Source: World Gold Council
Demand
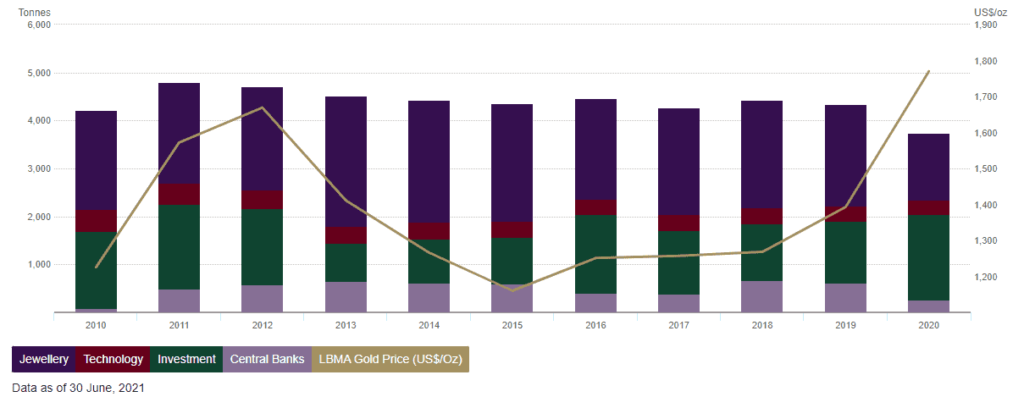
Demand also ranges around the 4,500 tonne mark but is more volatile due to investment flows that can vary significantly. However, the pandemic last year caused three major changes – one in investment flows, one in the jewellery market and one in Central Bank purchases. These help explain gold’s ascension to all time highs last year and why gold has underperformed in 2021. The total demand in 2020 was 3,731 tonnes – the lowest in the last 10 years of data and down 14% on 2019. The demand shortfall is entirely explicable by the pandemic, with the greatest impact hitting jewellery demand and also Central Bank purchases.
Source: World Gold Council
Jewellery demand in 2020 was 1,401 tonnes, down 36% on a 10 year average of 2,196 tonnes
Investment demand in 2020 was 1,773 tonnes, up 32% on a 10 year average of 1,347 tonnes
Central Bank demand in 2020 was 255 tonnes, down 46% on a 10 year average of 475 tonnes
Jewellery Demand
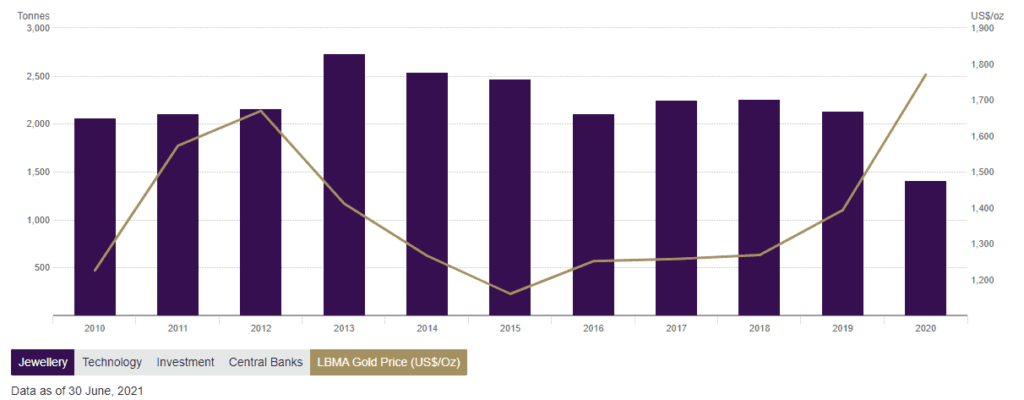
Below is chart of annual jewellery demand in tonnes
Source: World Gold Council
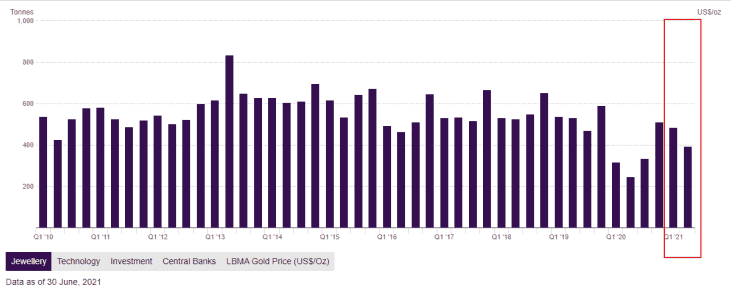
You can see that the pandemic contributed to a decisive drop in jewellery demand in 2020 at 1,401 tonnes, down 34% from 2,123 tonnes in 2019. This drop of 722 tonnes corresponds to a drop of 16% of typical annual demand, a very significant change. The jewellery demand figures were particularly weak in the first 2 quarters of 2020, of course being driven by the pandemic and lockdowns. As the world has recovered, so has jewellery demand but it’s still below pre-pandemic levels. China’s recovery has been better with jewellery demand in H1 2021 at 338 tonnes – back in line with typical H1 numbers and up 122% on H1 2020. However, India suffered from a Covid resurgence in spring this year which again hampered jewellery demand. India’s jewellery demand in H1 2021 was 158 tonnes, whilst up on last year, is still 46% below the 2019 H1 number. India cut its import tax on gold in February from 12.5% to 7.5% which should help aid a quicker recovery in demand. The chart below shows quarterly jewellery demand with the first two quarters of 2021 included. Whilst we can see that it hasn’t recovered to pre-pandemic levels, we are confident that as long as there are no further significant surges of covid causing longer lockdowns, then jewellery demand will recover from 2022 onwards. That recovery to normality will boost demand in 2021 by 400 tonnes compared to 2020, and a further 400 tonnes in 2022 until it’s closer to its longer term average of 2,200 tonnes. This additional demand will help put a floor under the gold price.
Source: World Gold Council
Investment demand
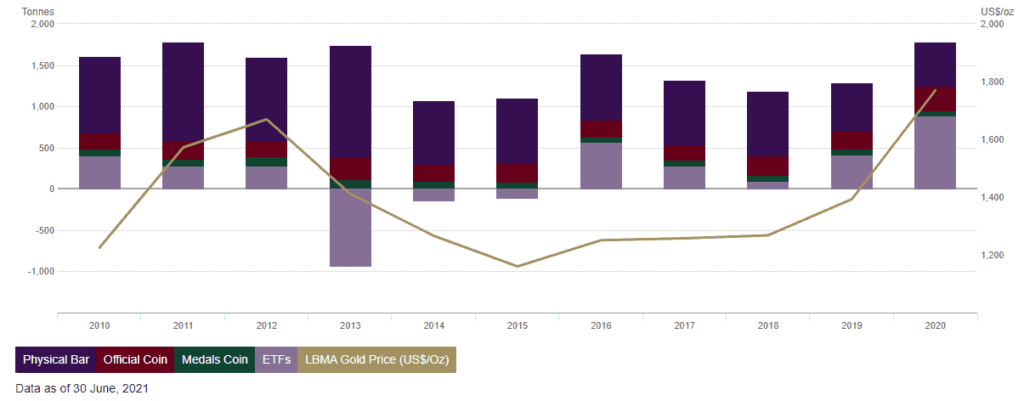
Investment demand in 2020 was very strong, up 32% on the 10 year average. This was driven by the huge fiscal and monetary easing from Governments and Central Banks globally in response to Covid. Money supply in the US was 25% higher one year later, real rates moved negative and the US 10 year nominal yield hit its lowest ever in August 2020. With the opportunity cost of gold dropping lower than anytime since 1980, gold was pushed to all time highs. 2020 saw the highest investment demand since 2010 data with 1,773 tonnes. About half of this was ETF flows with the remainder physical bars and coins. Unlike jewellery demand, investment demand can be much more volatile and forms the marginal demand that helps drive the gold price. Even within investment demand, ETF flows are the most volatile. This makes sense, they’re easy to liquidate and more speculative than physical purchases which are used as longer term holdings for wealth preservation.
Gold Investment Demand
Source: World Gold Council
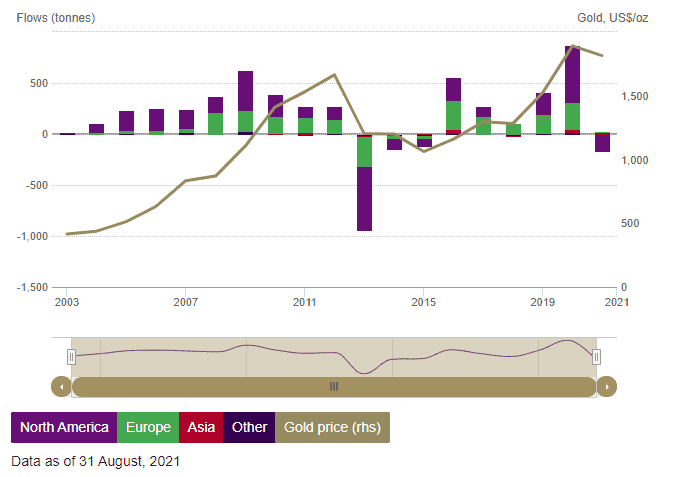
Below is a chart of ETF flows in physical gold ETFs. It includes 2021 up until 31st August.
Gold ETF Flows
Source: World Gold Council
As we can see from the chart above, ETF flows can vary wildly from -938 tonnes in 2013 to +874 tonnes in 2020 against more normal levels of +400 tonnes. There has been some ETF liquidation in Q4 last year and Q1 this year. Q2 saw a resumption of ETF inflows. It’s natural that some people will take profits at all time highs, some will instead choose to chase the S&P while it continuously rallies, some will be concerned (wrongly in my view) about Fed tightening and some will simply follow momentum or sentiment. With gold already undervalued vs money supply, real rates and the S&P, I think the chances of further ETF outflows from here will be limited. ETFs were quick to drain in 2013 and we haven’t seen that at all this time around.
Central Bank Demand
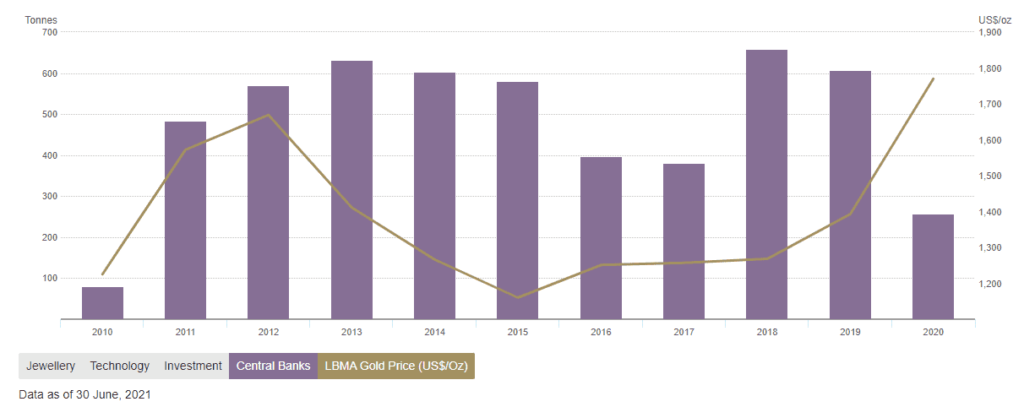
Central Banks have been large buyers of gold over the last decade, averaging around 500 tonnes per year. In the first half of 2021, Central Banks bought 333 tonnes. This year, Thailand added 80 tonnes to reserves, Brazil added 40 tonnes and Hungary added 60 tonnes. Out of the top 10 largest Central Bank gold purchases since 2010, 4 have taken place this year. It would seem that Central Banks firmly acknowledge the role gold continues to play in the global financial system and that should confidence in a currency be lost, backing it with gold is one method that helps restore that confidence. Russia have boosted their gold reserves from 900 tonnes to 2300 tonnes over the last 10 years. The reason has been to reduce dependency on an increasingly debased US Dollar. Central Banks know that currencies globally are being debased, and will continue to be debased, so holding reserves in an asset that holds purchasing power seems prudent.
Central Bank purchases were 255 tonnes in 2020, down 58% on 2019 as Central Banks used the liquidity from FX cash reserves to help governments fund covid measures. However, with the worst of the pandemic behind us, Central Bank purchases have rebounded sharply to 333 tonnes in H1 2021. These purchases will continue to put a floor under the gold price.
Source: World Gold Council
Futures
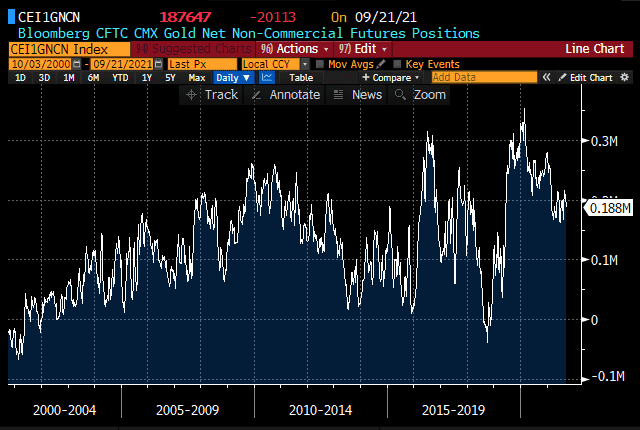
Futures positioning has also weakened since last year’s highs, non-commercials net long position has dropped from 350k contracts to 188k contracts at the time of writing. Open interest is 493k contracts, down from last year’s highs of 800k contracts and fairly in line with typical OI seen from 2011-2018. This does suggest that futures positions have already been washed out and will offer better support from here.
Gold net non-commercial futures positions
Source: Bloomberg
As the world recovers from the Covid pandemic, we expect jewellery demand to recover to former levels and put a floor under the gold price. We also expect Central Bank demand to remain strong as emerging economies seek to limit dependency on the dollar and attract a perception of economic strength. Investment demand can be more volatile, but with high levels of currency debasement, inflation concerns, persistent negative real rates, the case looks strong for gold.
