gold report chapter 2 why gold should be above $2000
Report by: Ben Jones Published: 29th September 2021
Key points:
M2 suggests gold should be closer to $2,200 / oz
Real rates suggest gold should be above $2,000 / oz
S&P the most expensive vs gold since 2005
Nasdaq the most expensive vs gold since 2001
Gold slightly expensive vs housing
It’s a valid question – how are you meant to price gold? It has maintained purchasing power for over 2500 years and over the same time frame protected against currency debasement that has taken place in ancient Greece, the Roman Empire, the reign of Henry VIII, ancient China and beyond. Currency debasement requires large increases in the supply of money, it is only natural that over long periods of time gold should track the money supply. It does, and we study it further below. In any investment decision, it’s wise to look at opportunity costs. As a non-yielding asset, the opportunity cost of gold is often looked at. What else could you buy? The S&P, Nasdaq, Government bonds, high (we might need to redefine the word high here) yield bonds, real estate. Each has perks and drawbacks, but we’ll compare gold against them to look at relative valuations.
Gold vs M2
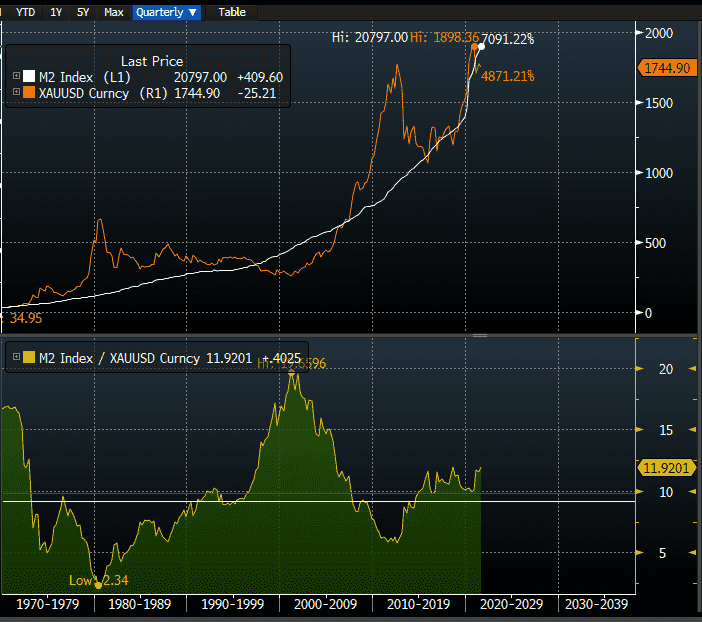
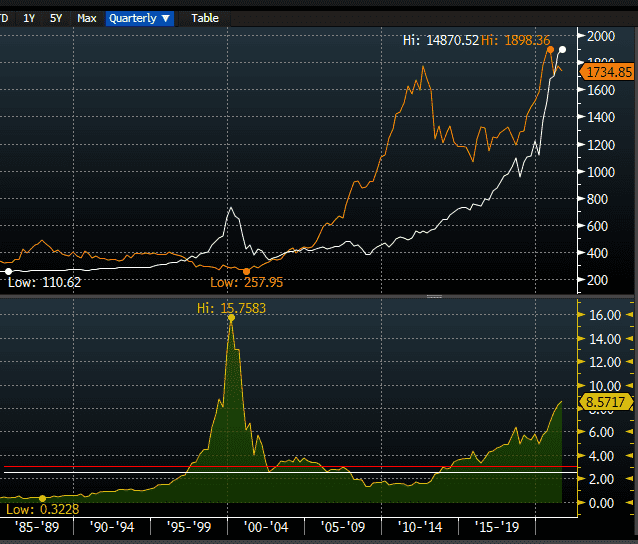
Over the long run, gold keeps pace with money supply. This is entirely logical, if a currency is to be debased through excess printing then gold will appreciate vs the devalued currency to maintain its purchasing power of real goods. Gold’s role as a store of value has existed for over 2,500 years no matter who is debasing their currency. We must acknowledge the supply of gold too, but at around 1.5% per annum, gold supply significantly trails money supply which averages 7.2% YoY going back to 1960. The chart below shows gold’s relationship with US money supply since 1971.
Source: Bloomberg
Looking at the top chart we can see that gold (orange) keeps pace with M2 money supply (white) but goes through periods of relative undervaluation and overvaluation. The ratio between the two is seen on the bottom chart. The average ratio between M2 and gold over the last 50 years is around 9.5. This would put gold today at around $2160 / oz. If you were to buy gold every time it fell behind money supply and sold as it exceeded it, you’d do pretty well. It is also worth noting that gold can be relatively over or undervalued for a number of years before trending back. This is due to medium term drivers such as inflation expectations, real rates, geopolitical tensions, or simply fear and sentiment. Whilst one must always be cautious extrapolating out money supply, if it were to continue at a pace of around $200bn per month, we would expect to see gold prices around $2700 in 2 years time. Of course gold may not follow money supply exactly, it may overshoot like it did in 2011 where a similar overshoot would put prices around the $4000 mark or it could continue to disappoint. Gold will ultimately correct itself against money supply and realise higher prices, it’s a matter of when not if, although trying to forecast timing is not an easy task. All the other factors I’ve discussed in this report would suggest the next 2 years ought to provide an excellent macro environment for gold but ultimately it will come down to patience.
Gold vs Real Rates
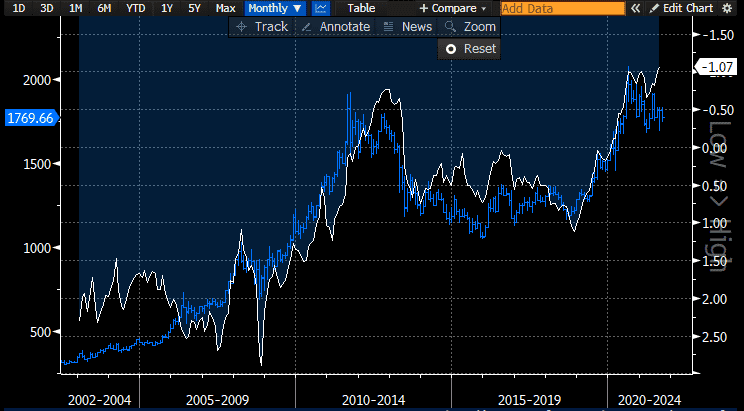
Real rates would be the number one considered ‘opportunity cost’ of gold – what real return could you get on the 10 year treasury instead? You can see from the chart below that gold has fairly reliably tracked real rates over the last 20 years. It’s important to note what we mean by real rates here. The 10 year real rate = nominal 10 year rate – inflation. But how are we measuring inflation in this instance? There are two options – we can use CPI or we can use the 10 year breakeven. If we were to use CPI which I would describe as the actual real rate we would get a 10 year real yield today of around -4%. This is the most negative since 1980 when the 10 year real yield hit -4%. It also hit -4% in 1974 during the first inflationary wave of the 1970s. Real yields have been more negative than this twice before – once in 1947 where inflation hit 20% coming out of WW2 and the Fed agreed with the treasury that they wouldn’t let long term rates rise beyond 2.5%. This was because at the time the US couldn’t afford the interest on debt and had no choice but to erode the value of debt through inflation. It resulted in a real yield around -18%. Similarly after WW1, the US was in the same position and from 1917-1920 inflation ran between 15-20% with the 10 year yield ranging from 3.5-5.5% resulting in a real yield ranging from -12 to -18%. This isn’t to say we’ll soon be hitting a -18% real yield but it gives an indication of where it’s been historically. However, the chart below uses 10 year breakevens as the inflation rate. The easiest way to think of 10 year breakevens is as the average inflation rate expected by the market over the next 10 years. That rate is currently 2.3% which seems low but it fully prices in the transitory argument peddled by the Fed. So when we look at the chart below, it is already pricing in transitory inflation. If inflation expectations were to rise significantly then the upside for gold would more closely emulate 1974 or 1980.
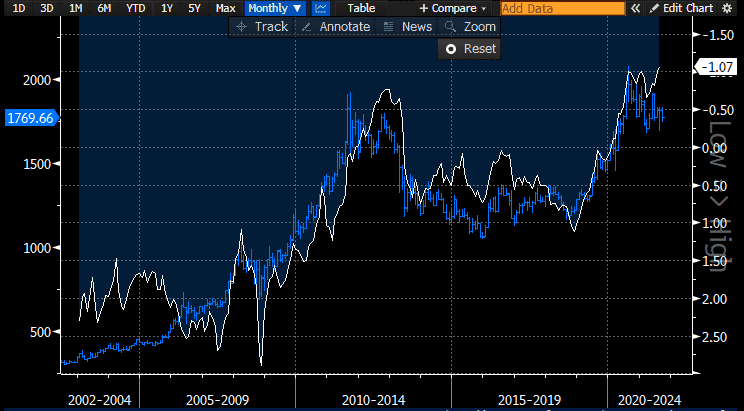
Gold in blue, LH axis
10 year real yield using breakevens in white, RH axis
Source: Bloomberg
Where is the real yield likely to head over the course of this decade? As we’ve discussed already, the government has no choice but to monetise debt and debt monetisation requires a negative real yield. There are two ways that monetisation can play out. The first option is that the Fed deliberately allows inflation to run hot but it overheats and we see inflation rates potentially hitting double digits. If this were to happen, inflation expectations would pick up and real rates would be driven much more negative than they currently are. Nominal yields would undoubtedly rise to offset the effect to some degree but if the inflationary periods from WW1, WW2 and the 1970s are anything to go by, it is likely that inflation will outpace the rise in nominal yields, at least to begin. The Fed would be reluctant to raise rates too quickly fearing that doing so would crash asset prices and cause a recession. They will first attempt to jawbone the market into believing inflation will soon subside. If it doesn’t then excessive rate hikes will be the only tool available. This type of outcome would likely see real rates move very negative at first, coupled with a strong move up in gold. The severity of the negative real rates would help erode the value of debt and eventually allow for a return to positive real rates in the long term.
The second option is that inflation does prove to be transitory and little tightening is required from the Fed. In this instance, nominal yields would very likely fall as inflation worries ebb and real rates would remain negative through low inflation and very low nominal rates. The outcome would be very similar to what we have witnessed in Europe and Japan. Either way, real rates will remain negative. In the first instance, gold would likely move a lot higher and quickly as people fear inflation getting out of control. It would fall back as and when inflation subsides. The second scenario would see gold grind higher over time and continue to track real rates and money supply.
Gold vs S&P & Nasdaq
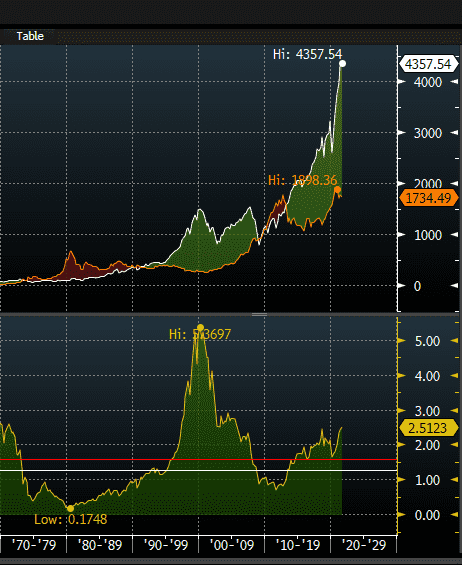
I see the S&P 500 as the key opportunity cost of gold for many investors. There is a reason that government bonds (and now I would say most of the credit market) have since been described as ‘return-free risk’. Paltry nominal returns that now almost overwhelmingly offer negative real returns aren’t particularly attractive. The natural place to turn is the equity market, and the world’s most liquid equity index, the S&P 500. However, easy financial conditions, low rate and large monetary stimulus have driven asset prices to exceedingly expensive levels. The S&P’s TTM P/E ratio is 34, the second highest in history after the dot com bubble. The nominal earnings yield is 2.94%, again the lowest since dot com (and now negative in real terms). The Buffett Indicator ( US market cap / GDP) is the highest in history at 239%. If history is any guide, the easy money has been made in the S&P 500 and it looks expensive vs most other assets (fixed income aside). The historical ratio between the S&P 500 and gold is a mean of 1.58 (red line on chart) and a median of 1.27 (white line on chart). Currently the ratio is 2.51, the highest since 2005, surpassing the ratios that marked the 2018 gold low and the 2015 gold low. While of course it’s possible that the ratio of S&P 500 / gold runs higher in the short term, history says it should eventually fall closer to its long term average. There are a growing number of reasons that caution against the S&P at current levels – inflation proving to be less transitory than the market currently thinks would see margins squeezed and rates rise faster than thought. This would put even more pressure on growth stocks. I’ve included a chart of the Nasdaq below with its long term mean average (red line) and median average (white line). The Nasdaq is the most expensive vs gold since 2001. Of course there are reasons that the nasdaq should have outperformed over the last decade, it houses America’s and the world’s largest and most profitable companies. However, valuations look stretched with bets on future growth that may not be realised and are discounted at phenomenally low rates, which if rise, could see significant corrections.
Source: Bloomberg
Source: Bloomberg
Gold vs Real Estate
Gold supply expands by about 1.5% per year with housing starts data showing housing supply in the US expanding by 1.2% per year. The chart below shows gold a little above its long term average vs house prices. Again, there will be discrepancies because housing is a one big ticket item, it’s not liquid, can’t be moved and so it’s not always easy to take advantage of opportunities in housing when they appear. Unlike gold which has none of those problems. Nevertheless housing is an excellent benchmark for hard assets and it’s worth keeping an eye on how gold compares.
Source: Bloomberg
